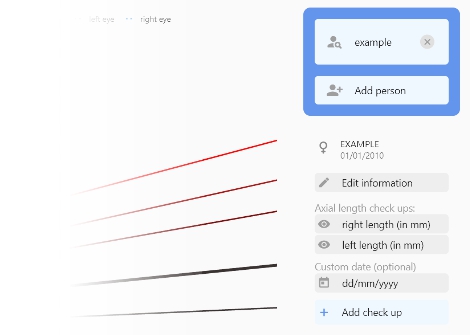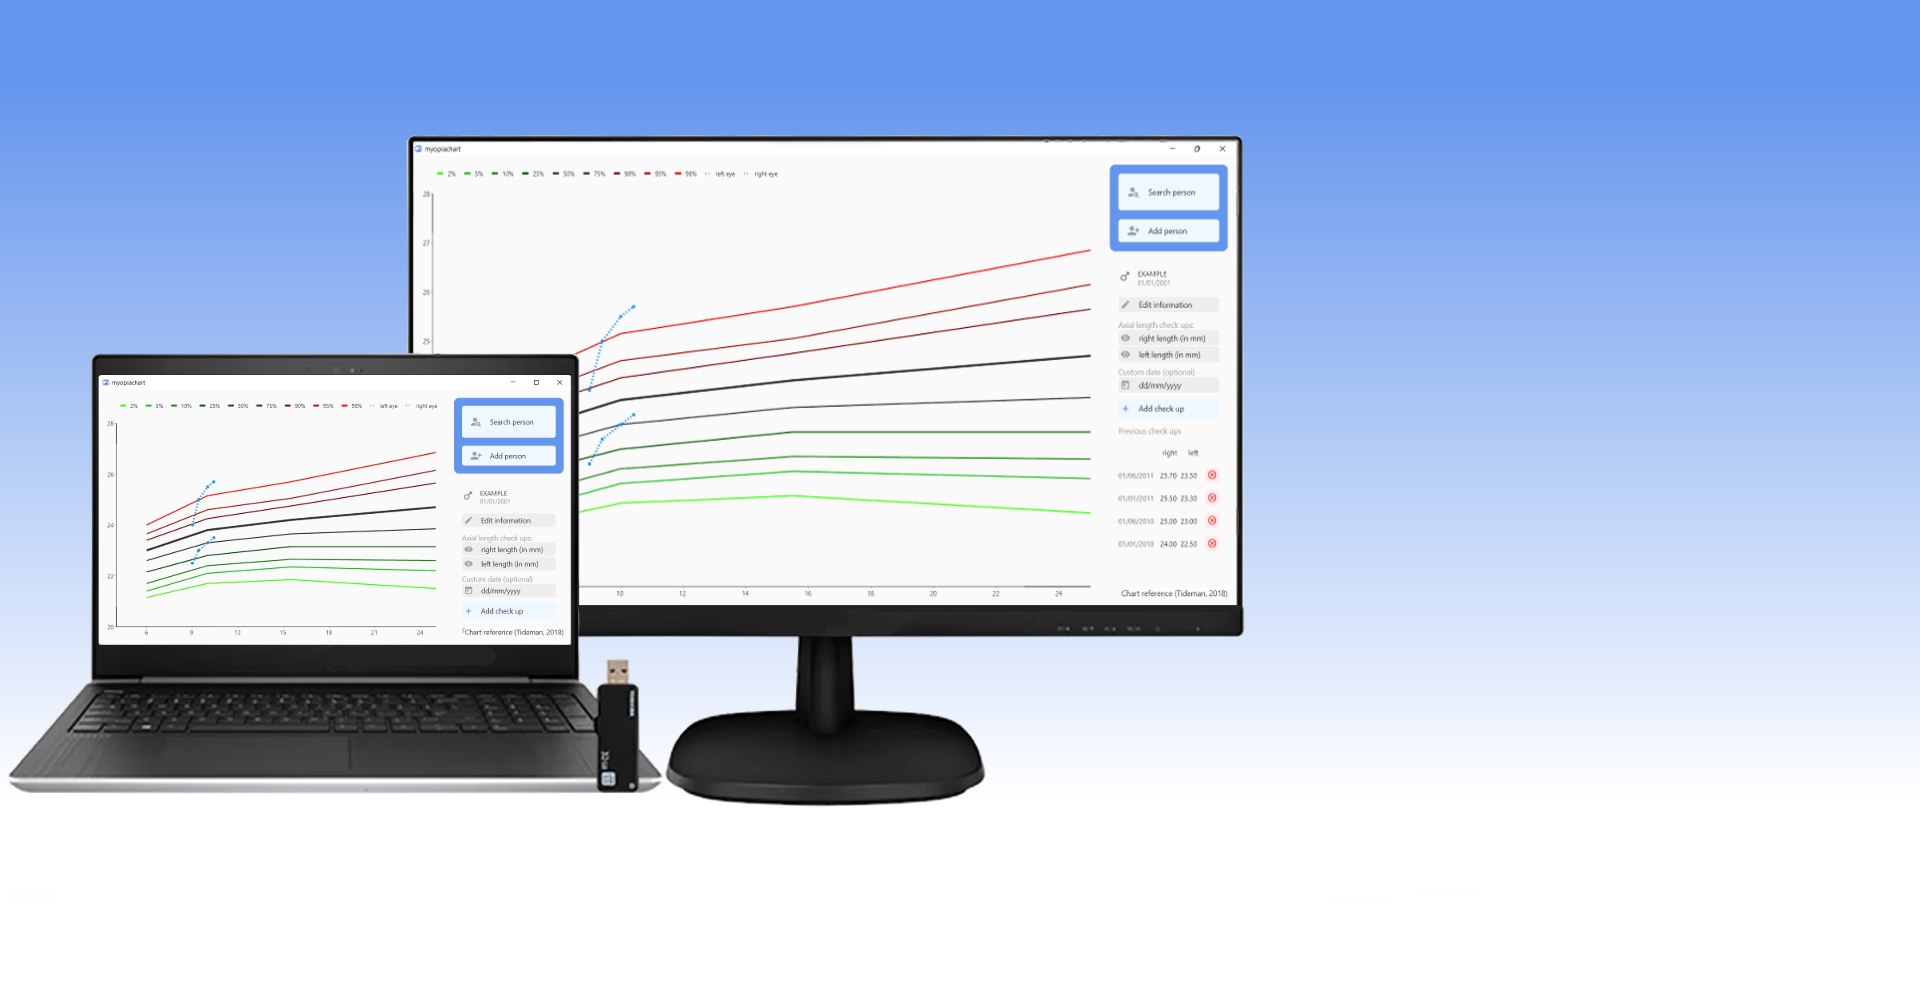
Introduce names and parameters on the right side. Easily search or add patients. Add axial length values and the graph is automatically updated! Previous measurements on earlier dates can be added if necessary. A detailed manual can be found here.
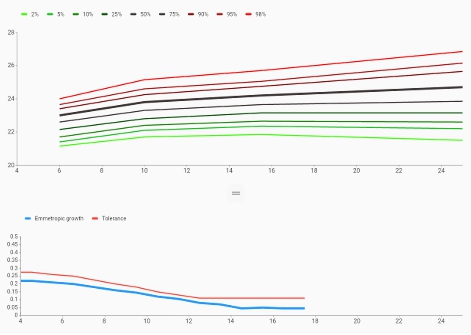
Plot the data on different graphs. With the build-in print functionality, the parents can take a printout of the Tideman chart home.
We do not process any information. The application only saves data you entered in the app on your local machine.
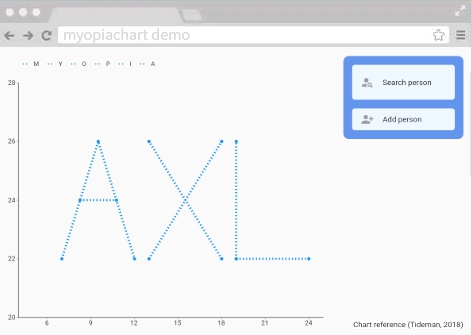
Not convinced yet whether you want to download the application? Give it a go with the online demo.
Please be aware that the data entered in the online demo can be deleted at any time.
Choose a download option that fits your needs.